
I’ve been saying for years that Google Analytics is probably the most valuable marketing tool a website manager has. But until recently, your metric options were often limited. Sure, there are Custom Metrics, and those can come in very handy in certain situations. But the inability to perform some simple math within GA could require some tedious activities to get the information we needed.
For example, you can easily see the average number of pages per session in the Audience Overview report. But suppose you are more interested in Pages Per User instead. All of the data is right there on the report to calculate it (Pageviews divided by Users). But you have to make that calculation manually. In some of the examples we’ll see below, this would get even more cumbersome on reports with several rows.
Enter Calculated Metrics
Back in November, Google Analytics introduced Calculated Metrics (still considered “beta” as of the writing of this article). Calculated Metrics allow you to create a new metric from a calculation of one or more GA standard metrics, and use them in Custom Reports. (Calculated Metrics are available only in Universal Analytics, another reason you should upgrade if you have not already.)
So in the above example, you could create a metric called Page Views per User, and define it as Pageviews / Users. Let’s go through it a little more closely.
Create The Metric
Calculated Metrics are created in the Admin section of your GA account, in the specific View you are working with.
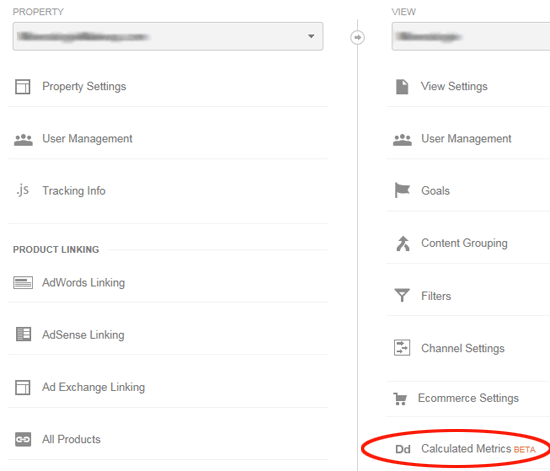
To create a Calculated Metric, go to your Admin section, choose your View, and click on the Calculated Metrics link
Click that link and then click the red “+ New Calculated Metric” button. Give your new metric a name. We’ll call this one Pages Per User. This will automatically populate the External Name as well.
Now choose the format—essentially the type of metric it is. Since this will likely be a decimal number, we’ll use “Float”. Then finally, we need to tell GA the actual calculation.
This is actually pretty easy. Google has some specific syntax, but they pretty much handle that for you. We know we want Pageviews/Users, so we just start typing and Google gives us options.
Start typing “Pageviews” and before you even finish, Google shows you metrics which match what you’ve typed. When you see Pageviews, just click on it. Then type the slash to represent division. Then start typing Users and select it when you see it.
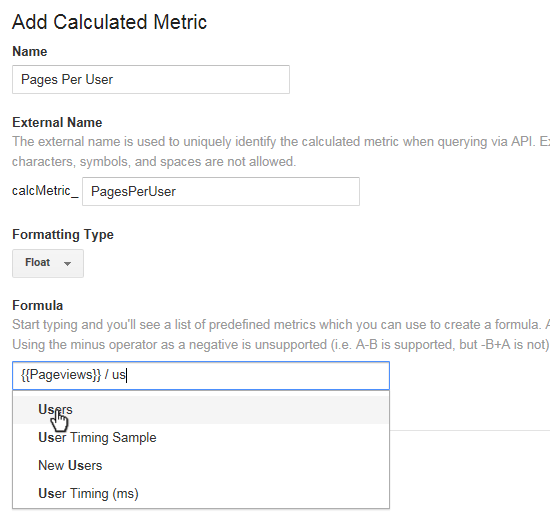
Start typing your calculation into the Formula box, and Google will guide you through the process.
The final formula should be {{Pageviews}} / {{Users}}
Click the blue Create button to save your work.
Now Use Your New Metric
Unfortunately, you can’t use Calculated Metrics in standard GA reports. You have to use them in Custom Reports. But it’s easy to do that! Click on Customization at the top of any page and then click the “+ New Custom Report” button.
Let’s give our new report a Title of “User Overview”, and use the “standard” metrics of Sessions, Users, and Pages / Session (just like what you see on the Audience Overview report). But let’s add a fourth metric—our calculated metric. And just for fun, let’s put in a dimension of Country here, to see how things vary by country of the user.
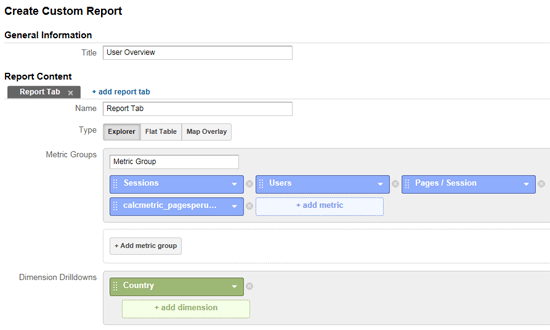
Use you Calculated Metrics in Custom Reports. Choose the calculated metric along with other standard metrics.
When you save the report, you see your standard metrics, but also the new one, labeled “calcmetric_pagesperuser” as you named it when you set it up. Here we see that while there are an average of 4.44 pages per session for this site, the pages viewed per user is 5.74. In the US, the span is greater (5.22 pages per session, 7.36 pages per user).
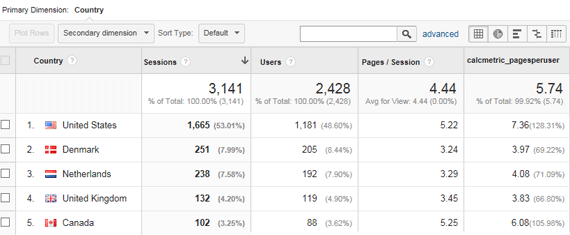
Using a Calculated Metric with a custom report shows that while Pages per Session was 4.44, Pages per User was 5.74. The difference is even larger in the United States.
Examples Where Calculated Metrics Are Helpful
Uncertain of the value of Calculated Metrics? Consider these possibilities!
Landing Page Revenue Per Entry
One question that marketers often need to answer, is just how much they can afford to bid for clicks in Pay Per Click advertising. This is fairly easy to calculate for the site as a whole, by dividing the total revenue generated (or for a lead generation site, the total value of all leads generated) by the total number of sessions.
But since different ads point to different landing pages, it makes sense to get this information by landing page. The Landing Pages report gives you revenue generated, and sessions, so in the past, you would have to dump that into Excel and add a column to perform the calculation. But Calculated Metrics saves us this step.
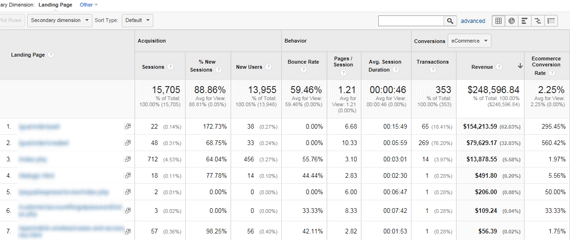
The standard Landing Page report shows a Conversion Rate for each landing page, but we want average revenue generated for each entry.
Create a “Landing Page Rev Per Entry” calculated variable with the formula of {{Revenue}} / {{Entrances}}.
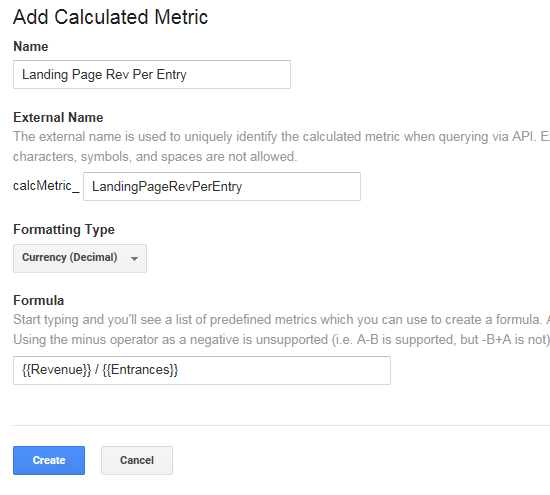
To find the average value of an entry for each Landing Page, our formula is Revenue / Entry.
Now we can create a Custom Report similar to the Landing Pages report. Let’s add these metrics: Sessions, Bounce Rate, Transactions, Revenue, and our new Calculated Metric (if you have trouble finding it, it should be stored in the Other category of metrics). Now we see that on this site, where the overall revenue per session had been $20.96, there are a couple of pages that generate significantly more revenue per entry than that average. We’d probably bid a lot more than $20 for ads pointing to these pages.
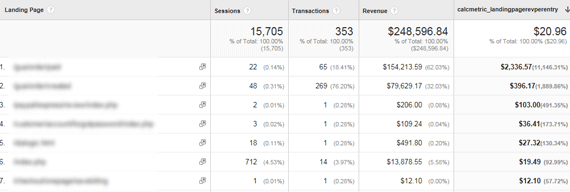
A custom report with Landing Page Revenue per Entry truly shows us the best performing landing pages.
Gross Margin Metrics
When it comes to decision making, looking at Revenue generated is often inadequate. For example, in the scenario above, on the surface it might seem that if our total revenue per session is $20.96, we’d be willing to pay up to that much per click. However, unless we have a zero Cost of Goods Sold, we’d lose money on that. We really want to know the profit generated per session.
Let’s say that our Gross Margin percentage is 40%. That is, if our Cost of Goods Sold for $100 of sales is $60, then we are making $40, or 40% on the sale. So in the example above, if we are generating $20.96 in revenue per session, our profit on that is actually only $8.38 (40% of $20.96).
Could we modify that Calculated Metric to be Landing Page Profit instead of Revenue? Yes! Just modify that formula to include the 40% margin: {{Revenue}} * 0.4 / {{Entrances}}
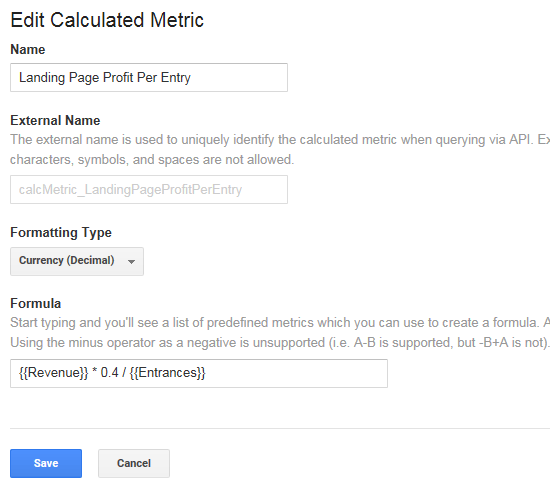
By adding in the Gross Margin percentage to the formula, we now get a truer picture of the profitability of each page.
Now if we modify our custom report to use this metric instead of the Revenue one, we see that the amount we can afford to pay per click has been reduced. But those high-performing pages still generate high profits for us.
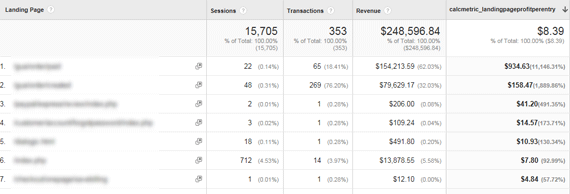
Now the report shows us how much we could pay for clicks to each page and still make a profit.
You can use Gross Margin analysis to help you in lots of places. If you change that formula to be Revenue times GM% divided by Sessions (instead of dividing by Entrances), you can get the true value of visits to your site which you can then segment by referral source, by device type, by geography, etc.
Deep Session Page Views
One of our clients, a magazine publisher that posts their content on their website, wanted to know which pages on the site are viewed most often, not counting the landing pages. That is, for any given article, most of the page views it receives are from someone finding it in a search engine.
The publisher was glad that they do so well in the search engines, but wanted to know, once someone arrived on the site, what other pages & articles were successful at keeping the user and extending the session. A good question!
A calculated metric worked perfectly for this. In terms of metrics, the publisher wanted to know the number of page views, less the number of landing page views (entrances). Or in GA syntax, that is {{Pageviews}} – {{Entrances}}.
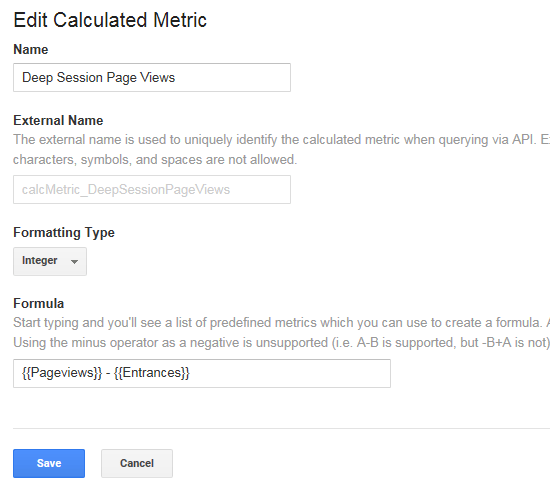
A calculated metric for Pageviews – Entrances shows us how often a page was viewed after the session has started. How many times someone clicked to each page from within our site.
Using this metric showed that the articles most often viewed in total also generated the most “deep session” page views. But it also identified some articles that had almost no entries but a lot of deep session views. The client knows to promote those pages better on the site. These pages also represent an opportunity for SEO improvements!
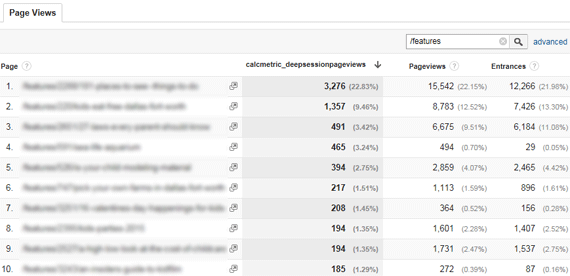
The most-often viewed pages in total were also the most often viewed pages after the session had started. But the fourth page listed had 465 “deep session” page views, and only 29 entries. This page should be promoted a little more to get even more clicks, extending the session for more users. It also might be an opportunity for some SEO fine-tuning.
Pop-Up Conversion Rates
I blogged recently about measuring the conversion rate of an opt-in pop up using Event Tracking. We had to use event tracking because the pop-up is displayed via a JavaScript script that decides whether to show it or not—there is no new page view, so we fire a Google Analytics Event when the pop-up is displayed. We use an event to track sign-ups as well, so as not to mix them with other avenues someone might use to sign up for the email list.
Using calculated metrics with specific events gets more tricky. You can create calculated metrics on things like Total Events, but not on total events of a specific category or action. So we created a goal specifically for email sign-ups from the pop-up (based on the Event that is fired), as we can create calculated metrics based on a specific goal completion.
However, we didn’t want to create a goal for Events where the pop-up was displayed, because this is not really an objective of the site and would mess up our conversion rate numbers, among other things. It’s never a good idea to create a goal for something that is not truly indicative of a value-added user session.
But since the event for displaying the popup and the event for a successful signup both have the Category of “Optins” (and they are the only events in that category), we can filter our custom report on this Category, and use the Goal along with Total Events to calculate our Conversion Rate. The number of times the pop-up is displayed is the Total Events, less the number of signups (our Goal 2 in this example).
So we set up the calculated metric as signups divided by the number of times the pop-up was displayed (which as we just said, is Total Events minus Goal 2 Completions). Our calculated metric formula was {{Email Signups (Goal 2 Completions)}} / ( {{Total Events}} – {{Email Signups (Goal 2 Completions)}} ).
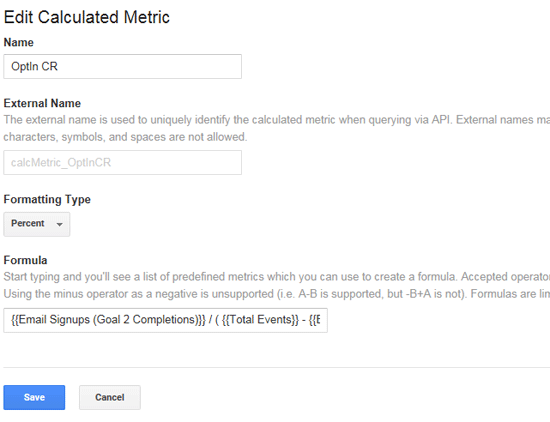
Our conversion rate formula will be Goal 2 Completions (successful opt-in signups from the pop-up) divided by Total Events minus the Goal 2 Completions. We will filter our custom report to only show events of Category “Optin”.
We then created the custom report. We chose metrics Total Events, Goal 2 Completions, and our calculated metric representing the conversion rate. However, if we stopped there, we would be comparing email signups to all events, not just events in the category Optin. So we added a Filter of Event Category equal to Optins. (This is the Category value we specify when the events are fired—it is not inherent to Google Analytics.)
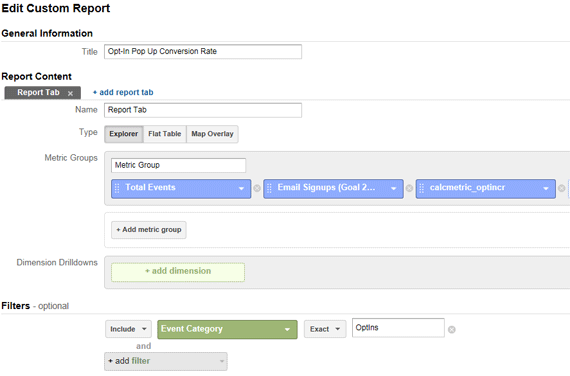
The only Events of Category “Optins” are for displaying the pop-up, and successful signups. So we filter our Custom Report on that Event Category, thereby calculating the correct Conversion Rate for the pop-up.
This report now gives us the conversion rate for the pop-up, and can be used in conjunction with any user Segment to see how the conversion rate changes based on things like referral source, campaign, mobile vs desktop, location, etc.
Goals With Different Confirmation Pages
For various reasons, there are often cases where a site has two or more very similar goals, but they are separated because they result in different confirmation page urls.
For example, we have a client that manufactures fireplaces with a website that has several goals of importance. The site gives you the opportunity to provide certain measurements and receive a customized quote back. However, the nature of their CMS results in different product quote forms finishing with different confirmation page urls. So each one is set up as a separate goal in Google Analytics.
The number of quote requests received is a critical Key Performance Indicator for this site. But they have other goals in GA as well, so we can’t just look at Total Goal Completions to see how many Quote Form Requests were filled out. We can therefore either manually add the three different Quote Form goals we have, or better, create a Calculated Metric to do that for us.
In this case, the Calculated Metric formula is:
{{Range Hood Worksheet (Goal 2 Completions)}} + {{Mantel Worksheet (Goal 3 Completions)}} + {{Product Page Quote Form (Goal 9 Completions)}}
And since there are other goals of importance on the site (registrations for CAD files, Catalog requests, etc.), it makes sense to create a Calculated Metric of Total Goal Completions per user (or per session): {{Goal Completions}} / {{Users}}.
How Do You Use Calculated Metrics?
The examples above are just the tip of the iceberg. I’d love to hear examples of how you are using them to help you make better marketing decisions. Please leave a comment to tell us!


