
When it comes to creating and maintaining a profitable website, there are many areas that need attention and care. Usability, Mobile Experience, SEO, Trust, Fresh Content, and accurate Analytics are just some of them. But one area I’ve seen getting more attention lately is the Site Speed, often referred to as Site Performance. If you can speed up your website, you can often see an increase in conversions.
Website speed is an important area to keep your eye on. It has been shown to have a direct correlation to your Conversion Rate and your Search Ranking. As far back as 2010, Google publicly stated that website speed is a ranking factor in their algorithm. And there have been many case studies showing a direct correlation between improvements in load times and conversion rates. Here are just a few:
- Retailer AutoAnything.com saw a 9% improvement in Conversion Rate, plus improvements in other key usage metrics, when they cut their load times in half.
- Online retailer Glasses Direct ran a test that showed that a one second delay in page load caused a 7% loss in customer conversions.
- Wal-Mart testing showed that for every one second reduction in page load, they saw a 2% increase in conversion rate.
So clearly, you need to be paying attention to how quickly the pages on your site load. The problem is, that sounds pretty technical, and many of us marketing-types are hesitant to tackle something like that.
Some Simple, Non-Technical Areas To Speed Up Your Website
Actually, there are probably aspects to your site that can be understood and cleaned up without having to get deep into code. And the tool I like to use to help with that is Webpagetest.org. Plus it’s free! This post is not an in-depth how-to guide for using WebPageTest, we’ll leave that to the techies. But let me show you how to run a simple test on your site and identify the quick-hitters to speed up your website.
Go to www.webpagetest.org and enter the url for your site or landing page and click Start Test. This will run a test on an actual computer in the US using a desktop browser. You can change some settings there to perform the test on other kinds of equipment, but we’ll stick to the default settings here.
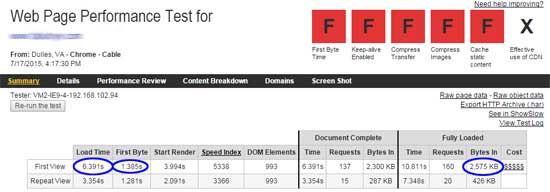
The top portion of the WebPageTest report provides some key metrics to try to improve. (Click to enlarge)
The test will probably take a few seconds to run (and it actually runs twice), but soon you’ll receive an extensive set of results. Don’t let all the charts, lines of files, and numbers intimidate you! This is a great tool to use and you can start by focusing your attention on just a few key results. (For more detailed information on using all that Webpagetest has to offer, you can start with its own online help, or search for any number of articles & tutorials. There’s even a book coming out.)
Key Measures
When you get your test results, focus on the top section of the page. Look at these performance indicators:
Load Time – This is essentially how long it took your page to load in the test. This number will change each time you run the test for various reasons, but the results should be fairly similar. Obviously, the lower the number, the better. How fast should it be? Well that depends on a number of things, but the idea here is to lower it.
First Byte – This is the number just to the right of the Load Time number. It is basically how long it takes for your browser to get something back from the server. It’s an indicator of some of the more technical aspects of your site, such as how efficient the code is and how strong your server is. It’s also been speculated that this is the metric that Google pays most attention to.
Bytes In (Fully Loaded) – This is how “heavy” your site is, how many bytes must be delivered from the server to your browser. Obviously, the heavier your site is, the longer it will take to load, on average. As we will see, one of the fastest ways to speed up your website is to make it lighter. This number should be pretty much the same each time you run the test until you change the page.
Report Card – See those letter grades at the top-right? I’m not ignoring them by any means. These represent the assessment WebPageTest makes of how efficient your site is. They give you a grade on an ABCDF scale of how well you are doing some basic things to make your page faster.
So with your first test, you have some baseline metrics, areas you want to try to improve. If you want, you can run the test a couple more times to kind of get an average for Load Time and First Byte. The Bytes In and Report Card grades should not change much at all in those tests.
Okay, you know how slow your site is, now how do we go about improving it? These are usually the first places I look. They are simple, easy-to-understand opportunities for having the greatest impact on making your page load faster.
Look At Your Biggest Images
As I said above, one of the simplest ways to speed up your website is to make your site lighter. Images generally make up the biggest chunk of a page’s weight so we start here. And by far, the most common problem I see is sites using images that are much larger, in terms of file size, than they need to be. It’s not uncommon for us to look at a site that has one or even more images that are over a megabyte, when they could easily be 95% smaller. There can be different causes of this, which I’ll get into in a minute. But first, you want to identify the largest images your site uses.
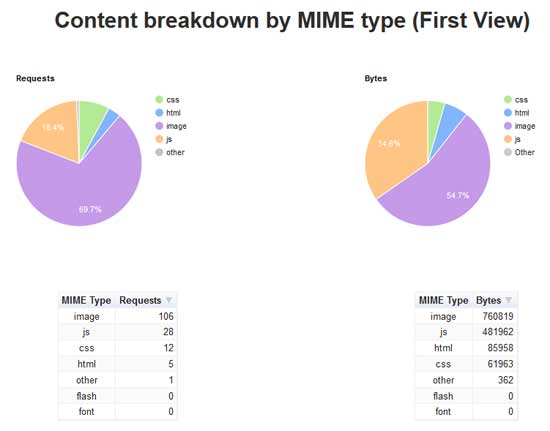
The Content Breakdown section of WebPageTest shows how many files and how many total bytes of each type of file your site uses. Images typically make up greater than 50% of the downloaded bytes for a site.
WebPageTest makes it easy to do this. If you click on the “Content Breakdown” tab, you will see how many images you have, and how many bytes they make up in total. If you click the “Details” tab and scroll down past what looks like big bar graphs, you’ll get a full list of every single file used to build your site. Scan the “Bytes Downloaded” column for the largest numbers. The Content Type column will identify the images. Quick Tip: copy this table and paste it into Excel to allow you to sort by Content Type and Bytes Downloaded to identify the heaviest images quickly.
Don’t spin your wheels looking at the small images. Focus on the heavy ones. It’s rare that I see an image over 50Kb that can’t be reduced. I generally see one or more of the following three situations causing images to have a larger file size than necessary.
Physical Dimensions Larger Than Being Shown
The most common problem I see is images that are uploaded at a much larger size than will be used to display them, and having your CMS or html code reduce them for display on the page. For example, you might have a page with room for a photo that is 365 pixels wide by 172 pixels tall. But like the example pictured from Harvard Business Reviwe, the photo that was actually uploaded to the server was 2000 x 940. You then have the html code or your CMS set to “size down” the image to the desired 365 x 172.
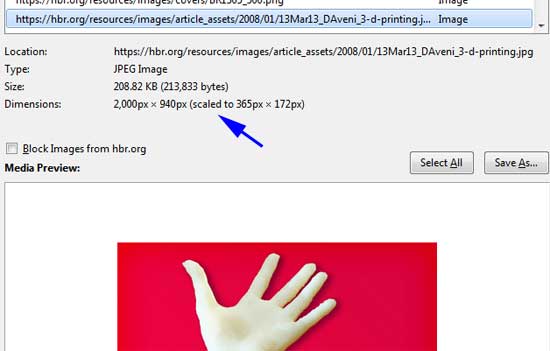
This image from a Harvard Business Review article is displayed at 365 pixels wide, although the actual file is 2000 pixels wide. The entire large file must be downloaded, but one sized properly would be much smaller to download. This image could easily be less than 10k instead of over 200k.
The problem here is that your browser has to download the large 2000 x 940 version. And there’s no point in that since you’re not displaying it that big. That file is five and a half times as big as it needs to be. You could reduce the weight of your page easily by resizing the photo to the proper physical dimensions and uploading that in place of the larger version.
High Resolution Photos
Almost all computer monitors display images at a resolution of 72dpi. However, I often see photos on a website with resolutions of up to 300 dpi. Most digital cameras take photos at much higher resolutions than 72. If you take a photo with a digital camera and upload it straight to your site, you’re probably uploading a file much larger than it should be.
Images That Are Not Compressed
Many images, especially JPG images, are created at varying levels of compression. The greater the compression level, the smaller the size of the image file in terms of bytes. But greater compression can also lead to a reduced level of quality of the image. Because of this, many people create their JPGs at much higher quality levels (less compressed) than they should be. The truth is, you can compress quite a bit before you start to see much quality loss at all.
The fourth Report Card grade on the WebPageTest, “Compress Images” assesses how well your site is serving up compressed images. If you score poorly here, you’ll want to look at your bigger images and get them resaved at a greater compression level. In fact, if you click on the Performance Review tab and scroll down to the “Compress Images” section, you’ll see a list of all the images that WebPageTest has identified that could be compressed more, along with an estimate of how many bytes that could save you.
Correct All of These Issues
All of these issues can be fixed essentially the same way. For any image that is in one of the situations above, simply locate the photo on your website and download it, noting the visual dimensions of the image on your page. (This is easy to do in Firefox for most images on your page. Just right-click on the image and choose “View Image Info”.)
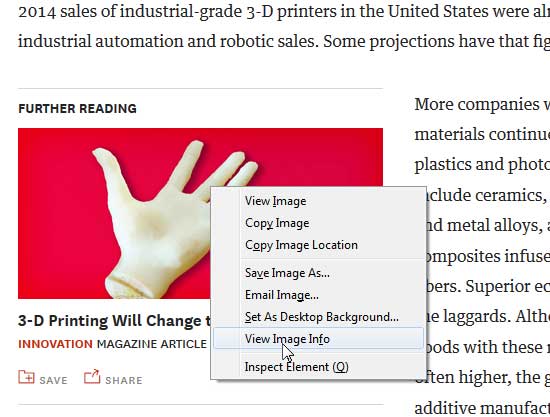
In Firefox, right-click on the image and choose View Image Info to see the dimensions and file size of the image.
Open the downloaded image in Photoshop and Save For Web. Make sure that you’ll be saving the image at the same dimensions as you’ll be using for display on your site. And if it’s a JPG file, make sure that your Quality level is at 60 or less. You can play around with that Quality level and see the effect it has on both the sharpness of the image and the projected file size before actually saving the file. Then simply re-upload the file back over the original bigger file.
If that is more technical than you wanted, you are at least armed with a list of the largest images on your page, and you can take that list of the heaviest-hitters to your developer to ask how they can be reduced.
Look At Your Text Files
In general, images typically make up about 50% to 80% of the total byte size of your page. In these days of html5, text files make up almost all of the remainder, either JavaScript, CSS, or html files. Use the list in your Details section of WebPageTest to see which of these files are the largest. Then see if any of them fit any of these situations.
Unused Scripts & CSS Files
Websites evolve. Over time, they change. New functionality is added. Skins are modified. Special treatments for the mobile UX are included. Better plugins replace older ones. But sometimes remnants of the old remain, even if they are no longer actually being used. This is just added weight, burdening the load time of your website without need.
Many sites link in locally hosted JavaScript files that generate things like image carousels, pop-ups, or other advanced functionality. And over time, designs get changed such that these components are not in use anymore. But it’s not often clear, just looking at code, what each script does. Coders are often hesitant to remove the links to those scripts for fear it might break the site unexpectedly. This is especially common if you’ve changed webmasters. Someone else added that script, and the new person isn’t sure what it’s for.
The result is that the site can link in scripts that are not used at all anymore. There are usually companion CSS files and images too. The total size of these files can be measured in the tens, even hundreds of Kb. That’s dead weight that is slowing down your page load.
Unused External Tools & Plugins
Similar to the hard-to-decipher code files described above, your site is probably loading multiple third-party scripts, or has third-party plugins which are not being used. Those are additional dead weight. They could be things like widgets from social sharing sites, external tools for analysis like CrazyEgg, Optimizely, or Google Analytics, or plugins/extensions for your CMS or shopping platform.
Identifying unused plug-ins should be fairly simple. Go into the admin panel of your CMS system or Shopping Cart system and look at the Plugins that are loaded. For example, if your site is in WordPress, go to the admin panel and click on Plugins. Do you have any that are not activated? Those are still probably loading up code and slowing down the processing time. If you have disabled plugins, delete them.
A great tool for identifying third-party scripts is the Ghostery extension for Chrome. Add this in and just browse to your web page. You’ll get a pop-up listing all of the third-party services the site is calling up. Some are probably critical such as Google Analytics. There may be other analysis tools or advertising platforms that you no longer use. Ghostery will give you an explanation about what each of these external tools is used for. This can be a big help in determining if there is anything unnecessary.

The JCPenney website loads over 40 different external scripts according to Ghostery. How many of those could be removed to improve load time? (Click to enlarge)
Uncompressed CSS & JavaScript Files
Okay, you’ve gone through your list of JavaScript, CSS, and html files and gotten rid of some you don’t need. You likely still have a lot that you could not remove. It’s not uncommon for us to find over a megabyte of these files. Not uncommon, that is, if they are not compressed. Text files compress so well—usually by better than 50%.
The nice thing is that you don’t have to tell your developer to compress their code each time they make a change. The compression can be done on the server when it serves up each file. This is usually done by changing one setting on the server—typically in the .htaccess file.
If that is sounding too technical, don’t fret. The WebPageTest Report Card grade titled “Compress Transfer” will tell you how well your site is doing this. If you’re getting a bad grade, you probably just need to turn on compression at your server. Your developer should be able to do that very quickly.
Check For Persistent Connections (Keep Alive)
This one is a little more technical, but still easy to understand and well worth it. Think about how a light bulb uses electricity. It uses a lot more power right when you turn it on than it does to keep it burning. It’s the same concept for the time it takes to download a file. A good portion of the time is taken up just by setting up the connection from your computer to the server.
So if your site has 10 images on it, each one of those must be downloaded, probably all from the same webserver. If you open and close the connection to that server for each of those images, that all adds up. In other words, it would take a lot more time to download 10 files that are 50Kb each, than it would to down load one 500Kb file, even though it’s the same amount of data being downloaded.
To get around this problem, your server can be set up to not close the connection after you download the first item, and to use that connection, keeping it open, until all of the files you need from that server have been downloaded.
Look at the second Report Card grade (Keep-alive Enabled) on your WebPageTest report. If you are getting a poor grade here, look at the Performance Review and see if the items causing the poor grade are on your domain. If so, just go to your developer and ask if they can get Persistent Connections (or Keep-alives) enabled. No code needs to be changed—it’s just a simple setting at the server. And making this one change can often speed up your website by 40% or more.
Server Issues
One of the metrics I mentioned up front is “First Byte Time”, and you can see there is also a Report Card grade for that. This can be an important indicator, but none of the things discussed so far will affect your First Byte Time. The First Byte Time is really an indicator of how well things are going at the server, and that’s a more technical discussion. But if you are getting a bad grade for First Byte Time, you definitely want to call it to the attention of your developer.
Sometimes when we see a bad grade, it’s just because the site is on a very crowded shared server, or a host that has sub-standard infrastructure. It may be time to move hosts or at least upgrade your plan. Other times, it’s a suboptimal configuration of the platform the site is built on. The important thing is to make your developer aware of it, and aware that it’s a priority for you (which it should be).
Speed Up Your Website Now
With the Holiday Season fast approaching, now is the time to eliminate some of the dead weight on your site and get your pages loading faster. There are obviously many other things you can do to squeeze out some more speed, but these are probably the areas to look at first to get the biggest improvement. Speed up your website and look to see how that improves your conversion. If you have success stories, please share them in the comments section here!


